The best cybersecurity risk reporting metrics show whether risk is moving toward or away from what your board has agreed to tolerate. They do not show how busy your security team has been. A board report that lists patches applied and alerts closed tells directors about effort. A good one tells them about exposure, how fast you respond, and what decision is needed from them.
This guide sets out which metrics to report, how to frame them, how often, and how to avoid the traps that turn a security report into noise. It is written for the people who sign off on risk: directors, CFOs, COOs, general counsel and the security leads who report to them.
TL;DR
- Report outcomes and risk, not activity. Counts such as “incidents worked” say little about whether exposure is falling.
- Use both KPIs (how well security processes perform) and KRIs (whether risk has crossed your tolerance), and label which is which.
- Give the board a one-page summary, at least quarterly, tied to your agreed risk appetite.
- Every metric needs an owner, a threshold and a pre-agreed action if the threshold is breached.
- Express metrics as ratios or proportions, so trends are visible whatever the size of the estate.
Table of Contents
- What the board actually needs from a cyber report
- KPIs and KRIs: the distinction that organizes everything
- The metrics worth reporting
- Metrics to retire from the board pack
- Give every metric an owner, a threshold and an action path
- Connect cyber metrics to business tolerances
- How to build the quarterly report
- Where the data comes from
- Our perspective: report so the board can act
- Getting reliable numbers for your next board pack
- FAQ
- Sources
What the board actually needs from a cyber report
The NCSC’s guidance on board-level cyber discussions is clear on the starting point: understand what matters most from the board’s perspective, then answer those questions first. That means the key risks, the mitigation plans and progress against them, rather than a tour of tooling.
The same guidance says boards should receive formal cyber security reports at least quarterly, aligned with the organization’s agreed cyber risk appetite and strategy, and recommends one-page summary dashboards for clarity. Its purpose is decision support, not technical volume.
That is also the direction of travel in regulation and expectation. The government’s Cyber Governance Code of Practice asks boards to embed cyber governance in the wider governance structure, with clearly defined roles and responsibilities. A report that nobody can act on does not meet that bar.
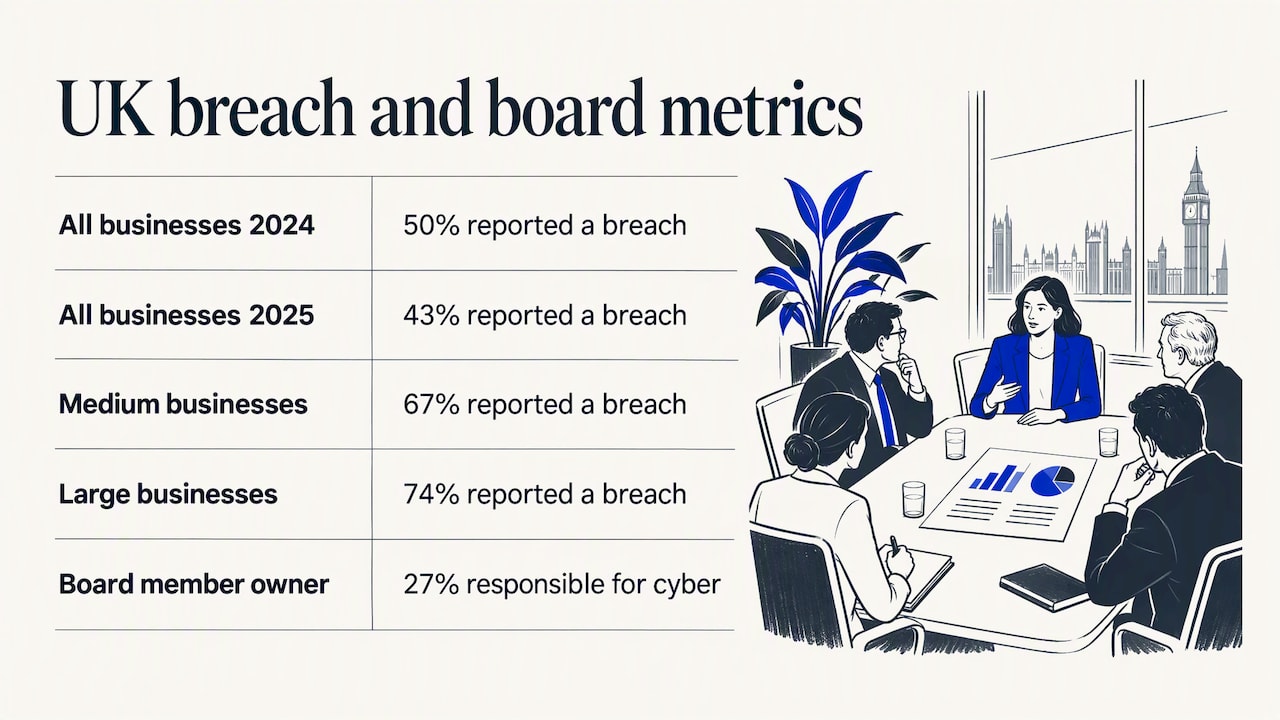
The gap between expectation and practice is wide. In the UK’s Cyber Security Breaches Survey 2025, 43% of businesses reported a breach or attack in the previous 12 months, down from 50% in 2024, but the figure is 67% for medium and 74% for large businesses. Commentary on the survey from a law firm notes that only 27% of businesses have a board member responsible for cyber security. If nobody on the board owns the topic, nobody is reading your metrics critically.
KPIs and KRIs: the distinction that organizes everything
Most weak reports mix two different kinds of measure. ISO/IEC 27004, as explained in ISACA’s guide to ISMS indicators, separates them:
- KPIs assess how successfully your organization implements security processes.
- KRIs show whether changes in your risk profile exceed tolerance limits.
A KPI looks back at how well a process performed. A KRI is the early-warning signal. Both belong in the report, but the board should be able to see at a glance which is which, because they prompt different questions. A weak KPI asks “is the process working?”. A breached KRI asks “are we still inside the risk we agreed to carry?”
The same ISACA guide gives example KRIs: the percentage of IT systems with vulnerabilities past their SLA, the percentage of employees clicking phishing links, and the percentage of systems without manufacturer support. Notice that each is a proportion with an obvious threshold.
The metrics worth reporting
There is no universal list, and any list that claims to be one is selling something. The table below is a practical starting set, grouped by the question a director would ask. Choose the handful that fit your risk appetite and drop the rest.
| Board question | Metric | Type | What a useful threshold looks like |
|---|---|---|---|
| Are we exposed? | Percentage of systems with vulnerabilities past their remediation SLA | KRI | An agreed ceiling by severity, for example none critical beyond SLA on internet-facing systems |
| Are we exposed? | Percentage of systems without manufacturer support | KRI | A target of zero for critical services, with a dated plan for exceptions |
| Are we exposed? | Coverage of multi-factor authentication on admin and remote access | KPI | A target set by policy, with exceptions listed by name |
| Are people the weak point? | Phishing simulation click rate and report rate | KRI / KPI | A falling click rate and a rising report rate over several quarters |
| Would we notice an attack? | Mean time to detect and mean time to respond, by severity | KPI | Targets set against your own impact tolerances |
| Would we notice an attack? | Percentage of critical assets feeding your monitoring | KPI | Close to full coverage of systems that support critical services |
| Can we recover? | Recovery time achieved in the last restore test against the target | KPI | Achieved time at or below the target the business agreed |
| Is the supply chain safe? | Percentage of critical suppliers assessed in the last 12 months | KPI | Full coverage of suppliers with access to data or systems |
| Are we improving? | Open audit and penetration test findings by age and severity | KRI | No critical finding open beyond the agreed window |
Two points about this table. First, every row ties to a decision: fund a fix, accept a risk, change a supplier. Second, nearly all are ratios, not raw counts.
Why ratios beat raw counts
A board paper from the European air traffic body Eurocontrol on reporting cyber risk to boards advises avoiding metrics that only track operational effort, such as incidents worked or malware quarantined. They are useful to technical teams but do not show risk reduction. It recommends proportions, such as vulnerabilities per system or incidents per 1,000 assets, so that variance is visible rather than volume of work.
The practical reason is simple. “412 vulnerabilities remediated” sounds like progress. If the estate doubled and new findings tripled, it is not. “7% of internet-facing systems past SLA, down from 12%” cannot be misread.
Metrics to retire from the board pack
If these appear in your current report, move them to the operational dashboard:
- Total alerts, tickets or incidents handled.
- Number of scans run or tools deployed.
- Malware blocked or emails filtered, with no denominator and no trend.
- Training completion rates alone, with no behavior measure alongside.
None is wrong as an operational measure. They simply do not answer a director’s question. NIST makes a similar point in its guidance on measuring and improving your cybersecurity: you do not need to crunch every number. The aim is to work out whether you are responding appropriately, looking at things like response time and impact on the bottom line, and to present it so non-statisticians understand it.
Give every metric an owner, a threshold and an action path
A metric without a threshold is a number. A metric with a threshold but no response is a worry. The practical standard, found in ISO 27004-style measurement programs, is that each measure has:
- An owner, a named person rather than a team.
- A data source, so the figure can be reproduced next quarter.
- A target and an acceptable range, agreed with the board’s risk appetite.
- A review frequency.
- An action path: what happens automatically if the threshold is breached, and who is told.
The NIST measurement guide, SP 800-55 Volume 2, frames measurement programs in the same way: they exist to support decision-making and improve performance and accountability.
The NCSC also offers a useful warning sign. If senior leaders struggle to say who is responsible for cyber security, your reporting structure is inadequate, however good the charts look.
Connect cyber metrics to business tolerances
The NCSC’s Board Toolkit on risk management expects cyber risk to sit inside the wider organizational risk process, with the method reviewed regularly, and not in a separate technical silo. In practice that means translating each risk into the language your business already uses: downtime, financial loss, regulatory exposure, reputation.
A useful test is the “so what” line under each metric. Compare:
- “Mean time to respond to high-severity incidents was 4.2 hours.”
- “Mean time to respond to high-severity incidents was 4.2 hours against a 2-hour target. At that speed, an attack on the payments platform would breach our agreed four-hour outage tolerance.”
The second sentence turns a technical figure into a board decision. Where a figure is illustrative, as here, say so in your own report and use your real numbers.
Sector matters too. Financial services firms, for example, work within regulator-led exercises. The Bank of England’s Financial Stability in Focus describes assessment programs such as CBEST and STAR-FS, which let firms test their defenses against realistic threat scenarios. If you are in scope, the results of those exercises belong in your risk reporting as evidence, alongside your own metrics.
How to build the quarterly report
- Start from the board’s questions. Ask directors what they need to decide this year. Pick metrics that inform those decisions.
- Agree risk appetite in numbers. “Low appetite for downtime” becomes a recovery time and an acceptable outage length.
- Choose 8 to 12 measures. More than that and the page stops being a page.
- Show trend, not a snapshot. Four quarters of data on one line says more than any single value.
- Use a traffic-light status only with defined thresholds. Red must mean a threshold was crossed, not that someone is nervous.
- Lead with decisions. Put “what we need from the board” at the top: approve budget, accept a risk, endorse a deadline.
- Add context in two or three sentences. Name the biggest change since last quarter and why.
- Keep detail in an appendix, ready if directors ask.
For boards that want help formalizing oversight, tools for structuring IT governance and tracking KPIs against decisions can help, such as this IT leadership decision-support approach for CIOs and CTOs (the page is in French).
Where the data comes from
Reporting is only as good as the telemetry behind it. Several of the metrics above depend on specific capabilities:
- Detection and response times need continuous monitoring. Managed SIEM and managed SOC services produce the timestamps behind mean time to detect and respond.
- Vulnerability ageing needs a process with owners, not just scanning. Our piece on the vulnerability management process covers how to avoid scanning without accountability.
- Control effectiveness is evidenced by independent testing: a penetration test or an IT security audit gives the board findings that are not self-assessed.
- Framework alignment matters if customers or regulators ask. See how Cyber Essentials, ISO 27001 and SOC 2 compare.
For wider context on how to think about exposure before you pick measures, read our guide to cyber security risk and UK cyber security business risk guide.
Our perspective: report so the board can act
We work with multi-location businesses where the same report has to serve a group board, regional managers and, often, a regulator. What we see repeatedly is that security teams have plenty of data and too little structure around it. The report grows heavier each quarter, and directors stop reading it.
Our view is that a security finding is only useful once it is explained in plain terms and attached to a roadmap. That is how we approach audits and testing: not a generic checklist, but findings the business can rank, own and close in order. The same discipline applies to metrics. If a measure cannot lead to a funded action or an accepted risk, it does not belong in front of the board.
We would also say start small. Five well-owned measures with real thresholds beat thirty dashboards. Add metrics as your monitoring matures and your board’s questions sharpen.
— Shirish
Getting reliable numbers for your next board pack
If your current report cannot show detection times, vulnerability ageing or independently tested control strength, the gap is usually in the underlying service, not the slide. Zero Through provides global IT support with managed SOC, SIEM, MDR, vulnerability management, penetration testing and security audits, scaled to multi-location organizations. We can help you establish the evidence behind your metrics and explain the results in terms your directors can use.
FAQ
How often should cybersecurity risk be reported to the board?
The NCSC recommends formal cyber security reports to the board at least quarterly. Between those, significant incidents or breached risk thresholds should be escalated immediately, under the action path you agreed in advance.
What is the difference between a KPI and a KRI in cyber security?
A KPI measures how well a security process performs, such as how quickly vulnerabilities are fixed. A KRI signals whether your risk profile has moved beyond the tolerance you agreed, such as the share of systems with overdue critical vulnerabilities. Under ISO/IEC 27004, both have a place, but they answer different questions.
How many metrics should a board report include?
Aim for roughly eight to twelve, on a one-page summary with a short appendix. The NCSC recommends one-page dashboards precisely because boards need clarity to make decisions, not every available figure.
Should we report the financial cost of cyber incidents?
Yes, where you can do so honestly, and with context. The government’s survey estimates the average cost of the most disruptive breach at £1,600 for businesses, or £3,550 excluding those reporting zero cost, but those are averages across mostly small firms. Use your own downtime, recovery and revenue figures to express impact for your organization.
Sources
- NCSC: Board-level cyber discussions, communicating clearly
- GOV.UK: Cyber Governance Code of Practice
- GOV.UK: Cyber Security Breaches Survey 2025
- Farrer: Cyber risk in the boardroom
- ISACA: Evaluation of ISMS performance through key indicators
- Eurocontrol: CISO Edition, Control, Measure, Report, Repeat
- NIST: Guidance on measuring and improving your cybersecurity
- NIST SP 800-55 Volume 2
- NCSC: Risk management for cyber security
- Bank of England: Financial Stability in Focus, March 2024